Multiple Choice
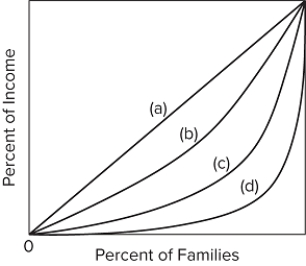 Refer to the diagram. If line (c) represents the distribution of income before taxes and transfers and line (b) represents the distribution after taxes and transfers, then taxes and transfers have
A) added to income inequality.
B) decreased the Gini ratio.
C) increased poverty.
D) reduced real GDP per person.
Correct Answer:

Verified
Correct Answer:
Verified
Q183: <img src="https://d2lvgg3v3hfg70.cloudfront.net/TB8602/.jpg" alt=" Refer to the
Q184: What is the argument for income inequality?
Q185: Which of the following is not a
Q186: In 2017, a household with an annual
Q187: Which of the following would be a
Q189: Which of the following measurement issues makes
Q190: The basic argument for income inequality is
Q191: The basic economic argument for greater income
Q192: <img src="https://d2lvgg3v3hfg70.cloudfront.net/TB8602/.jpg" alt=" In Venezuela, there
Q193: The highest quintile of households in the