Multiple Choice
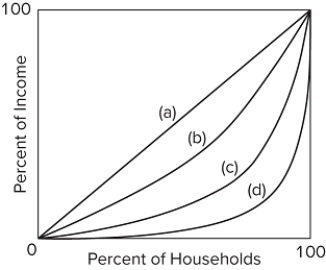 Refer to the figure. The Gini ratio would be 0 for which curve?
A) a
B) b
C) c
D) d
Correct Answer:

Verified
Correct Answer:
Verified
Related Questions
Q170: Suppose that a prejudiced African-American employer has
Q171: Social Security payments are primarily made to
Q172: Suppose an employer is biased against African
Q173: A curve showing the quintile distribution of
Q174: The Lorenz curve portrays<br>A)the functional distribution of
Q176: <img src="https://d2lvgg3v3hfg70.cloudfront.net/TB8602/.jpg" alt=" Assumptions: (1)the labor
Q177: In 2017, the number of TANF recipients<br>A)was
Q178: Which of the following Gini ratios indicates
Q179: List the various causes of income inequality
Q180: What have been the trends in income