Multiple Choice
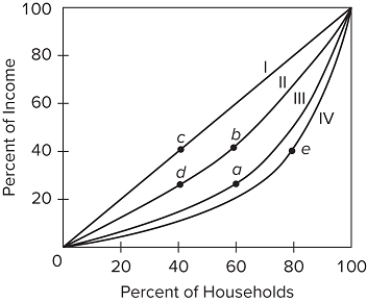 Refer to the figure, which shows four different Lorenz curves (I, II, III, and IV) . The movement from point b to point a in the graph would indicate that the
A) lower 40 percent of households increased their share of total income from 25 percent to 40 percent.
B) lower 40 percent of households decreased their share of total income from 60 percent to 40 percent.
C) lower 60 percent of households decreased their share of total income from 40 percent to 25 percent.
D) lower 40 percent of households increased their share of total income from 40 percent to 60 percent.
Correct Answer:

Verified
Correct Answer:
Verified
Q104: About a quarter of all U.S. households
Q105: Standard census data on the distribution of
Q106: One of the provisions of the Temporary
Q107: Discrimination<br>A)affects the distribution of domestic output and
Q108: Wealth in the United States is<br>A)distributed in
Q110: <img src="https://d2lvgg3v3hfg70.cloudfront.net/TB8602/.jpg" alt=" Refer to the
Q111: In 2017, the fourth quintile of households
Q112: In 2017, a household with an annual
Q113: Two major criticisms of the Bureau of
Q114: In the quintile distribution of income, the