Multiple Choice
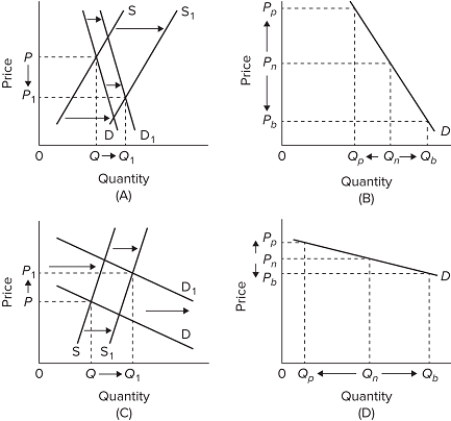 Which diagram best represents the problem faced by farms in the short run?
A) A
B) B
C) C
D) D
Correct Answer:

Verified
Correct Answer:
Verified
Related Questions
Q34: The Agricultural Act of 2014<br>A)ended 60 years
Q35: The price elasticity of demand for food
Q36: Government and private efforts to promote the
Q37: If the prices paid by farmers increase
Q38: The Conservation Reserve Program<br>A)bought up farmland to
Q40: Explain why the demand for food is
Q41: <img src="https://d2lvgg3v3hfg70.cloudfront.net/TB8602/.jpg" alt=" Refer to the
Q42: Farm share of U.S. GDP has<br>A)declined from
Q43: An increase in the supply of farm
Q44: <img src="https://d2lvgg3v3hfg70.cloudfront.net/TB8602/.jpg" alt=" Refer to the