Multiple Choice
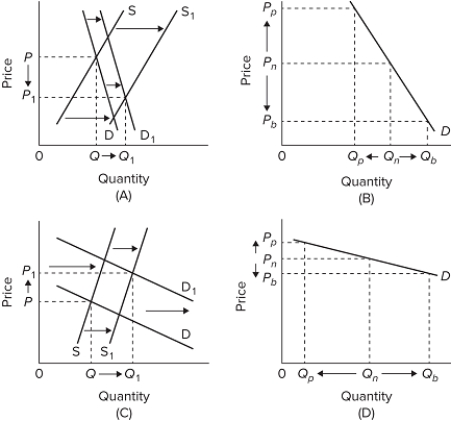 Which diagram best represents the problem faced by farms in the long run?
A) A
B) B
C) C
D) D
Correct Answer:

Verified
Correct Answer:
Verified
Related Questions
Q42: Farm share of U.S. GDP has<br>A)declined from
Q43: An increase in the supply of farm
Q44: <img src="https://d2lvgg3v3hfg70.cloudfront.net/TB8602/.jpg" alt=" Refer to the
Q45: About 10 percent of the U.S. labor
Q46: The parity ratio initially stood at 0.5.
Q48: In 2015, Farmer Levi grew only soybeans
Q49: Farm programs such as those of the
Q50: An example of the special interest effect
Q51: The demand for most agricultural products is<br>A)elastic
Q52: The ambitious plan to wean American agriculture