Multiple Choice
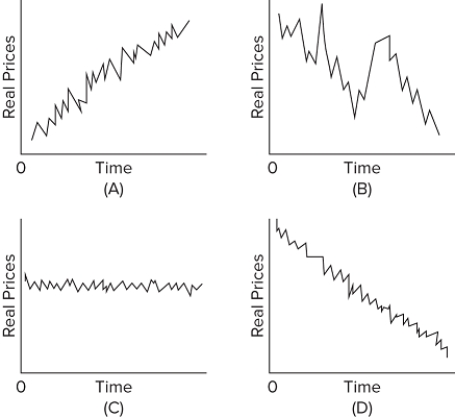 Which of the diagrams best describes the long-run path of real (inflation-adjusted) farm prices?
A) A
B) B
C) C
D) D
Correct Answer:

Verified
Correct Answer:
Verified
Related Questions
Q255: Which of the following would, other things
Q256: The price of a certain farm product
Q257: The major factor contributing to lower prices
Q258: The Agricultural Act of 2014 does not
Q259: Since the 1930s, the U.S. government has
Q260: Farm price support programs tend to<br>A)benefit both
Q262: The average income of U.S. farm households
Q263: Which of the following countries has the
Q264: The purpose of the Freedom to Farm
Q265: <img src="https://d2lvgg3v3hfg70.cloudfront.net/TB8602/.jpg" alt=" Refer to the