Multiple Choice
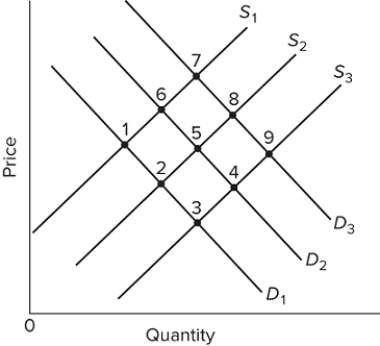 Refer to the graph of the supply and demand for agricultural products. If point 1 reflects the supply and demand for agricultural products in the U.S. in the 1950s, then which point would best characterize long-run change in the equilibrium for agricultural products since that time?
A) 2
B) 4
C) 7
D) 8
Correct Answer:

Verified
Correct Answer:
Verified
Q233: What is the Conservation Reserve Program? Comment
Q234: <img src="https://d2lvgg3v3hfg70.cloudfront.net/TB8602/.jpg" alt=" Refer to the
Q235: The Food, Conservation, and Energy Act of
Q236: The price of a certain farm product
Q237: Which of the following statements about U.S.
Q239: Which of the following statements describes how
Q240: If the parity ratio goes from 1
Q241: Farmers, though a small proportion of the
Q242: If turnips are an example of an
Q243: Which of the following illustrates the basic