Multiple Choice
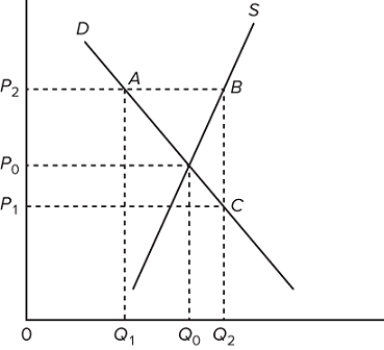 Refer to the graph of the market for wheat. The government adopts a price support program for wheat and supports the wheat price at P ₂. The triangular area defined by points B and C and the intersection of the supply and demand curve represents the
A) parity ratio.
B) taxpayers' burden.
C) efficiency gain.
D) efficiency loss.
Correct Answer:

Verified
Correct Answer:
Verified
Q70: Discuss the two new types of crop
Q71: The government's promotion of greater production and
Q72: It is estimated that the price elasticity
Q73: What has been the rationale made over
Q74: What are the major economic effects on
Q76: Which of the following statements best describes
Q77: Discuss the criticism of the parity concept.
Q78: Recent government policies to provide price and
Q79: A significant reason that increases in demand
Q80: What is the reason why large, short-run