Multiple Choice
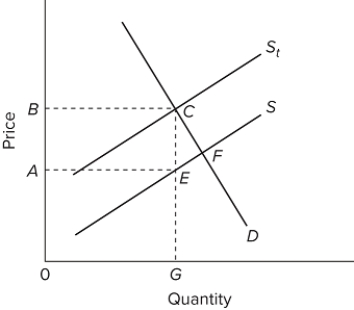 In the figure, S is the before-tax supply curve and Sₜ is the supply curve after an excise tax is imposed. The total tax collection from this excise tax will be area
A) ABCE + ECF.
B) ABCE.
C) ECF.
D) 0 BCG.
Correct Answer:

Verified
Correct Answer:
Verified
Related Questions
Q310: Approximately what percentage of state spending goes
Q311: The federal income tax is consistent with
Q312: Taxable income is<br>A)total income less deductions and
Q313: Which of the following is necessarily true
Q314: Explain the difference between marginal and average
Q316: If the demand for a product is
Q317: The total amount of U.S. tax revenue
Q318: In 2018, corporate income taxes contributed about
Q319: In 2018, personal income taxes contributed what
Q320: Suppose that government imposes a specific excise