Multiple Choice
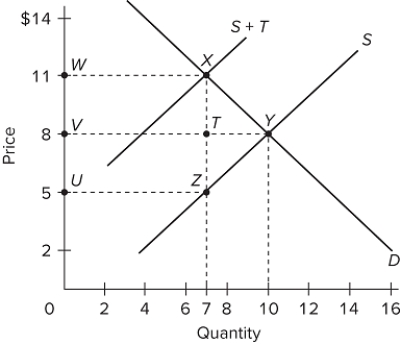 The graph illustrates the market for a product on which an excise tax has been imposed by government. What is the amount of the tax per unit of product?
A) $3
B) $5
C) $6
D) $8
Correct Answer:

Verified
Correct Answer:
Verified
Q37: <img src="https://d2lvgg3v3hfg70.cloudfront.net/TB8602/.jpg" alt=" The graph illustrates
Q38: In determining one's personal income tax, taxable
Q39: Given supply, the more inelastic the demand
Q40: In 2016, the top 1 percent of
Q41: The federal gasoline tax is assessed on
Q43: Tax shifting refers to the fact that<br>A)sellers
Q44: <img src="https://d2lvgg3v3hfg70.cloudfront.net/TB8602/.jpg" alt=" Refer to the
Q45: A regressive tax means that if someone
Q46: Government borrowing<br>A)is the primary means of financing
Q47: In 2018, the so-called Tax Freedom Day