Multiple Choice
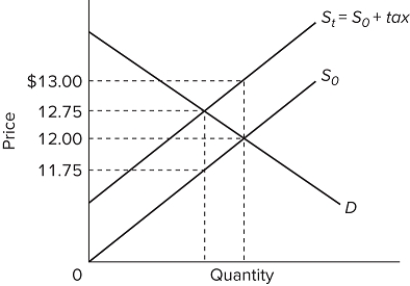 The graph shows the supply curve for a product before tax ( S ₀ ) and after an excise tax is imposed ( S ₁) . The excise tax on the product is ultimately paid
A) by buyers only.
B) by sellers only.
C) 75 percent by buyers and 25 percent by sellers.
D) 25 percent by buyers and 75 percent by sellers.
Correct Answer:

Verified
Correct Answer:
Verified
Q51: When the government is doing "deficit spending,"
Q52: Given demand, the more inelastic the supply
Q53: According to data compiled by the Bureau
Q54: <img src="https://d2lvgg3v3hfg70.cloudfront.net/TB8602/.jpg" alt=" In the figure,
Q55: With a proportional tax, higher-income persons will
Q57: The ability-to-pay principle of taxation<br>A)has been declared
Q58: An income tax is progressive if the<br>A)absolute
Q59: If you would have to pay $5,000
Q60: Which of the following taxes is least
Q61: The marginal tax rate is<br>A)the difference between