Multiple Choice
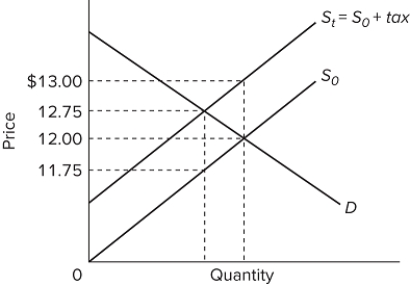 The graph shows the supply curve for a product before tax ( S ₀ ) and after an excise tax is imposed ( S ₁) . If 500 units of the product are sold after the tax is imposed, the amount of the tax borne by the consumer is
A) $125.
B) $250.
C) $375.
D) $500.
Correct Answer:

Verified
Correct Answer:
Verified
Q80: <img src="https://d2lvgg3v3hfg70.cloudfront.net/TB8602/.jpg" alt=" In the diagram,
Q81: <img src="https://d2lvgg3v3hfg70.cloudfront.net/TB8602/.jpg" alt=" The table shows
Q82: The more inelastic are demand and supply,
Q83: <img src="https://d2lvgg3v3hfg70.cloudfront.net/TB8602/.jpg" alt=" In the diagram,
Q84: From 1960 to 2018, as percentages of
Q86: If each taxpayer paid the same lump-sum
Q87: What is a regressive tax? Explain why
Q88: If everyone pays a fixed dollar amount
Q89: A tax that takes a larger proportion
Q90: If you pay a $2,000 tax on