Multiple Choice
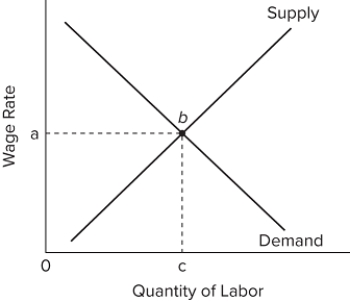 The graph represents the supply and demand for labor in a purely competitive market. The area 0 abc represents
A) total revenue of the firm.
B) total earnings of labor.
C) marginal revenue product of labor.
D) marginal labor cost.
Correct Answer:

Verified
Correct Answer:
Verified
Q139: <img src="https://d2lvgg3v3hfg70.cloudfront.net/TB8602/.jpg" alt=" The table shows
Q140: What explanations are offered for why unions
Q141: In the demand-enhancing union model, a union
Q142: If the nominal wage falls by 2
Q143: Suppose in some economy there are 100
Q145: <img src="https://d2lvgg3v3hfg70.cloudfront.net/TB8602/.jpg" alt=" A firm's labor
Q146: A profit-maximizing firm will<br>A)expand employment if marginal
Q147: <img src="https://d2lvgg3v3hfg70.cloudfront.net/TB8602/.jpg" alt=" The table shows
Q148: What is human capital? How is it
Q149: What are the economic effects of imposition