Multiple Choice
 In the diagram, (1) is the
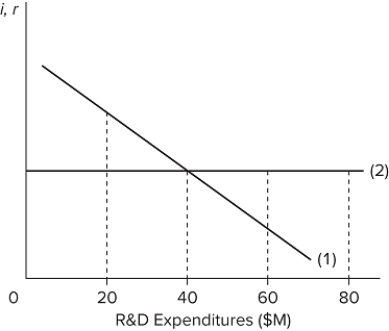
A) expected-rate-of-return curve, and (2) is the average total cost curve.
B) total revenue curve, and (2) is the interest-rate cost-of funds-curve.
C) expected-rate-of-return curve, and (2) is the interest-rate cost-of-funds curve.
D) marginal cost curve, and (2) is the marginal benefit curve.
Correct Answer:

Verified
Correct Answer:
Verified
Q10: Large, well-established firms are more likely to
Q11: <img src="https://d2lvgg3v3hfg70.cloudfront.net/TB8602/.jpg" alt=" The table shows
Q12: Violin strings made from sheep intestines were
Q13: <img src="https://d2lvgg3v3hfg70.cloudfront.net/TB8602/.jpg" alt=" Refer to the
Q14: Explain the reasoning behind the inverted-U theory
Q16: The profit-enhancing impact of process innovation tends
Q17: According to the inverted-U theory of R&D,
Q18: The first successful commercial introduction of a
Q19: R&D spending decisions are complicated because<br>A)costs of
Q20: <img src="https://d2lvgg3v3hfg70.cloudfront.net/TB8602/.jpg" alt=" The table shows