Multiple Choice
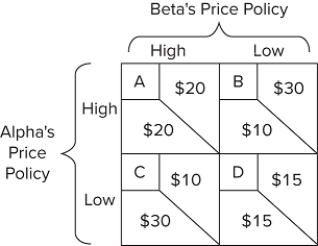 Refer to the diagram, where the numerical data show profits in millions of dollars. Beta's profits are shown in the northeast corner and Alpha's profits in the southwest corner of each cell. Which cell represents a Nash equilibrium?
A) The two firms will be maximizing joint profits.
B) Y would find it advantageous to raise its price if it were certain X would not alter its price.
C) X would find it advantageous to raise its price if it were certain Y would not alter its price.
D) both firms would find it advantageous to collude to raise their prices by $1 each.
Correct Answer:

Verified
Correct Answer:
Verified
Q278: An empty threat is a statement of
Q279: Industries X and Y both have four-firm
Q280: OPEC provides an example of<br>A)an unwritten, informal
Q281: List the three main models of oligopoly
Q282: Prices are likely to be least flexible<br>A)in
Q284: <img src="https://d2lvgg3v3hfg70.cloudfront.net/TB8602/.jpg" alt=" This industry shown
Q285: A cartel of four firms that controls
Q286: What obstacles might a group of oligopolists
Q287: <img src="https://d2lvgg3v3hfg70.cloudfront.net/TB8602/.jpg" alt=" Refer to the
Q288: Industry Y is dominated by five large