Multiple Choice
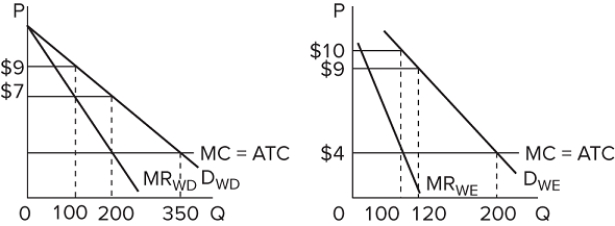 The graphs represent the demand for use of a local golf course for which there is no significant competition. (It has a local monopoly.) P denotes the price of a round of golf, and Q is the quantity of rounds "sold" each day. If the left graph represents the demand during weekdays and the right graph the weekend demand, then over the course of a full seven-day week, this price-discriminating, profit-maximizing golf course should sell a total of
A) 300 rounds.
B) 740 rounds.
C) 900 rounds.
D) 1,200 rounds.
Correct Answer:

Verified
Correct Answer:
Verified
Q295: A natural monopoly occurs when<br>A)long-run average costs
Q296: Price discrimination is not viable if consumers
Q297: <img src="https://d2lvgg3v3hfg70.cloudfront.net/TB8602/.jpg" alt=" If the industry
Q298: Comparing a pure monopoly and a purely
Q299: If a monopolist's marginal revenue is $3.00
Q301: A monopolist can use its pricing strategy
Q302: If marginal costs decrease and the MC
Q303: Any activity designed to transfer income or
Q304: Given a downward-sloping linear demand curve, if
Q305: <img src="https://d2lvgg3v3hfg70.cloudfront.net/TB8602/.jpg" alt=" Answer the question