Multiple Choice
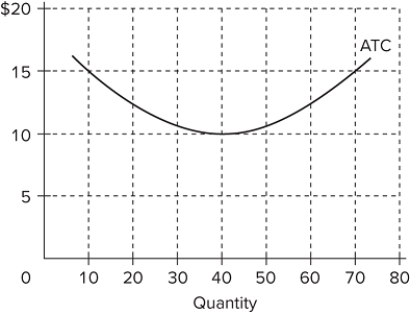 The diagram shows the average total cost curve for a purely competitive firm. At the long-run equilibrium level of output, this firm's total revenue
A) is $10.
B) is $40.
C) is $400.
D) cannot be determined from the information provided.
Correct Answer:

Verified
Correct Answer:
Verified
Q73: Creative destruction is least beneficial to<br>A)workers in
Q74: Resources are efficiently allocated when production occurs
Q75: The theory of creative destruction was advanced
Q76: Efficiency or deadweight losses occur in purely
Q77: <img src="https://d2lvgg3v3hfg70.cloudfront.net/TB8602/.jpg" alt=" Refer to the
Q79: In the long run for a purely
Q80: If there is a decrease in demand
Q81: Assume a purely competitive increasing-cost industry is
Q82: The economic profits generated by Elon Musk's
Q83: Suppose that the corn market is purely