Multiple Choice
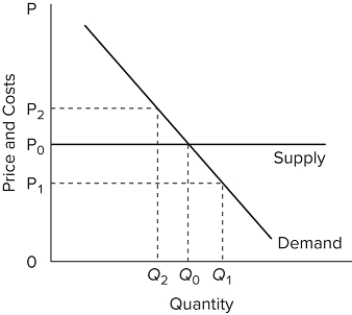 The accompanying graph shows the long-run supply and demand curves in a purely competitive market. The curves suggest that in this industry, the dollars' worth of other products that have to be sacrificed in order to produce each unit of the output of this industry is
A) constant.
B) increasing.
C) decreasing.
D) not indicated in the graph.
Correct Answer:

Verified
Correct Answer:
Verified
Q114: When a competitive firm sees losses because
Q115: In a purely competitive industry, an optimal
Q116: In pure competition, if the market price
Q117: Assume a purely competitive increasing-cost industry is
Q118: When LCD televisions first came on the
Q120: After long-run adjustments, a purely competitive market
Q121: If the price of product Y is
Q122: <img src="https://d2lvgg3v3hfg70.cloudfront.net/TB8602/.jpg" alt=" The accompanying graph
Q123: The average life expectancy of a U.S.
Q124: <img src="https://d2lvgg3v3hfg70.cloudfront.net/TB8602/.jpg" alt=" Line (2)in the