Multiple Choice
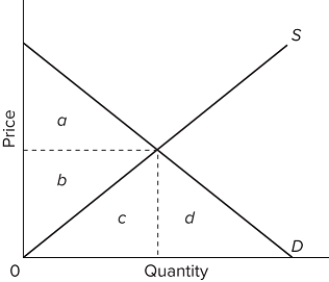 The accompanying graph represents the purely competitive market for a product. When the market is at equilibrium, the total revenues from selling the equilibrium output level would be represented by the area
A) a + b + c.
B) b.
C) b + c.
D) b + c + d.
Correct Answer:

Verified
Correct Answer:
Verified
Q5: The reason why the long-run supply curve
Q6: What three assumptions are used in the
Q7: Resources are efficiently allocated when production occurs
Q8: Is there a specific amount of time
Q9: Under pure competition, in the long run<br>A)neither
Q11: An increasing-cost industry is the result of<br>A)higher
Q12: The long-run supply curve for a competitive,
Q13: Long-run adjustments in purely competitive markets primarily
Q14: Because the equilibrium position of a purely
Q15: The transformative effects of competition that foster