Multiple Choice
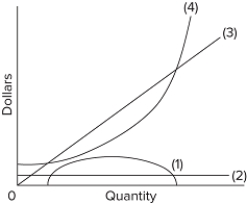 Curve (2) in the diagram is a purely competitive firm's
A) total cost curve.
B) total revenue curve.
C) marginal revenue curve.
D) total economic profit curve.
Correct Answer:

Verified
Correct Answer:
Verified
Q32: <img src="https://d2lvgg3v3hfg70.cloudfront.net/TB8602/.jpg" alt=" At P ₃
Q33: The lowest point on a purely competitive
Q34: An industry comprising 50 firms, each with
Q35: The short-run supply curve of a purely
Q36: <img src="https://d2lvgg3v3hfg70.cloudfront.net/TB8602/.jpg" alt=" The accompanying table
Q38: A competitive firm will maximize profits at
Q39: <img src="https://d2lvgg3v3hfg70.cloudfront.net/TB8602/.jpg" alt=" Refer to the
Q40: The fact that a purely competitive firm's
Q41: <img src="https://d2lvgg3v3hfg70.cloudfront.net/TB8602/.jpg" alt=" The provided graph
Q42: <img src="https://d2lvgg3v3hfg70.cloudfront.net/TB8602/.jpg" alt=" Refer to the