Multiple Choice
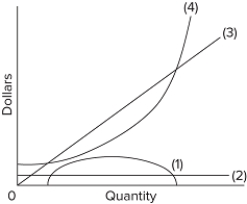 The firm represented by the diagram would maximize its profit where
A) curves (2) and (1) intersect.
B) curve (1) touches the horizontal axis for the second time.
C) the vertical distance between curves (3) and (4) is the greatest.
D) curves (3) and (4) intersect.
Correct Answer:

Verified
Correct Answer:
Verified
Q26: If a purely competitive firm is producing
Q27: <img src="https://d2lvgg3v3hfg70.cloudfront.net/TB8602/.jpg" alt=" At output level
Q28: <img src="https://d2lvgg3v3hfg70.cloudfront.net/TB8602/.jpg" alt=" In a typical
Q29: <img src="https://d2lvgg3v3hfg70.cloudfront.net/TB8602/.jpg" alt=" The firm represented
Q30: Which of the following is not a
Q32: <img src="https://d2lvgg3v3hfg70.cloudfront.net/TB8602/.jpg" alt=" At P ₃
Q33: The lowest point on a purely competitive
Q34: An industry comprising 50 firms, each with
Q35: The short-run supply curve of a purely
Q36: <img src="https://d2lvgg3v3hfg70.cloudfront.net/TB8602/.jpg" alt=" The accompanying table