Multiple Choice
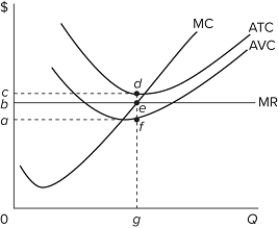 Refer to the accompanying graph for a purely competitive firm operating at a loss in the short run. Which area in the graph represents the portion of total costs that the firm can recoup by continuing to produce rather than shutting down?
A) 0 beg
B) bcde
C) acdf
D) abef
Correct Answer:

Verified
Correct Answer:
Verified
Q186: A purely competitive firm currently producing 30
Q187: Assume that labor is a variable input.
Q188: An industry comprising 40 firms, none of
Q189: <img src="https://d2lvgg3v3hfg70.cloudfront.net/TB8602/.jpg" alt=" Refer to the
Q190: <img src="https://d2lvgg3v3hfg70.cloudfront.net/TB8602/.jpg" alt=" The first table
Q192: In answering the question, assume a graph
Q193: A competitive firm in the short run
Q194: <img src="https://d2lvgg3v3hfg70.cloudfront.net/TB8602/.jpg" alt=" Refer to the
Q195: The short-run supply curve slopes upward because
Q196: <img src="https://d2lvgg3v3hfg70.cloudfront.net/TB8602/.jpg" alt=" The accompanying table