Multiple Choice
Solve the problem.
-Data regarding the amount spent by a government department is represented in the following graph. Find the rate of change of the amount spent with respect to time, in billions per year. 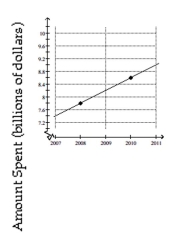 Year
Year
A) Increase of $0.10 billion per year
B) Decrease of $0.2 billion per year
C) Decrease of $0.3 billion per year
D) Increase of $0.2 billion per year
Correct Answer:

Verified
Correct Answer:
Verified
Q16: Determine whether the given ordered pair is
Q17: Find the coordinates of the y-intercept and
Q18: Find the slope of the line.<br>-3x -
Q19: Graph the line containing the given pair
Q20: Find the slope of the line.<br>-<img src="https://d2lvgg3v3hfg70.cloudfront.net/TB8504/.jpg"
Q22: Find the slope of the line.<br>-<img src="https://d2lvgg3v3hfg70.cloudfront.net/TB8504/.jpg"
Q23: Write the word or phrase that best
Q24: Graph the linear equation.<br>-<img src="https://d2lvgg3v3hfg70.cloudfront.net/TB8504/.jpg" alt="Graph the
Q25: Graph the line containing the given pair
Q26: Find the x- and y-intercepts for the