Multiple Choice
Solve the problem.
-An accountant tabulated a firm's profits for four recent years in the following table:  The accountant then fit both a linear graph and an exponential curve (seen below) to the data, in order to estimate future profits. Use the linear graph to estimate the profits in the year 2001.
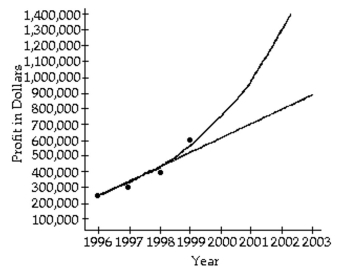
A) About $500,000
B) About $700,000
C) About $800,000
D) About $900,000
Correct Answer:

Verified
Correct Answer:
Verified
Q147: Graph the equation of the relation using
Q148: Use a calculator and the change-of-base formula
Q149: Using a calculator, find to the nearest
Q150: Graph.<br>-f(x) = <img src="https://d2lvgg3v3hfg70.cloudfront.net/TB8504/.jpg" alt="Graph. -f(x) =
Q151: Solve the problem.<br>-The half-life of a certain
Q153: Find the logarithm.<br>-<img src="https://d2lvgg3v3hfg70.cloudfront.net/TB8504/.jpg" alt="Find the logarithm.
Q154: Graph the function as a solid curve
Q155: Express as a single logarithm.<br>-<img src="https://d2lvgg3v3hfg70.cloudfront.net/TB8504/.jpg" alt="Express
Q156: Express as a single logarithm.<br>-<img src="https://d2lvgg3v3hfg70.cloudfront.net/TB8504/.jpg" alt="Express
Q157: Solve.<br>-<img src="https://d2lvgg3v3hfg70.cloudfront.net/TB8504/.jpg" alt="Solve. - A) 27