Multiple Choice
Solve the problem.
-An accountant tabulated a firm's profits for four recent years in the following table:  The accountant then fit both a linear graph and an exponential curve (seen below) to the data, in order to estimate future profits. Use the exponential graph to estimate the profits in the year 2002.
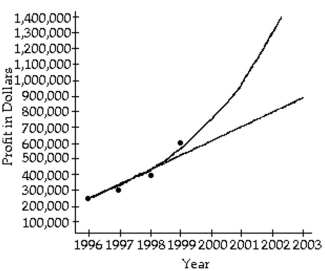
A) About $1,000,000
B) About $1,700,000
C) About $1,300,000
D) About $750,000
Correct Answer:

Verified
Correct Answer:
Verified
Q251: Find the requested composition of functions.<br>-Given f(x)
Q252: Graph the function.<br>-<img src="https://d2lvgg3v3hfg70.cloudfront.net/TB8504/.jpg" alt="Graph the function.
Q253: Determine whether the function is one-to-one.<br>-f(x) =
Q254: Solve the equation.<br>-<img src="https://d2lvgg3v3hfg70.cloudfront.net/TB8504/.jpg" alt="Solve the equation.
Q255: Graph.<br>-<img src="https://d2lvgg3v3hfg70.cloudfront.net/TB8504/.jpg" alt="Graph. -
Q257: Find the logarithm.<br>-<img src="https://d2lvgg3v3hfg70.cloudfront.net/TB8504/.jpg" alt="Find the logarithm.
Q258: Find the requested composition of functions.<br>-Given f(x)
Q259: Find the logarithm.<br>-log8 8<br>A) 1<br>B) 0<br>C) 8<br>D)
Q260: Solve the problem.<br>-In a study by psychologists
Q261: Express in terms of logarithms of a