Multiple Choice
Solve the problem.
-An accountant tabulated a firm's profits for four recent years in the following table: 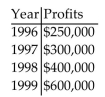 The accountant then fit both a linear graph and an exponential curve (seen below) to the data, in order to estimate future profits. Use the linear graph to estimate the profits in the year 2002.
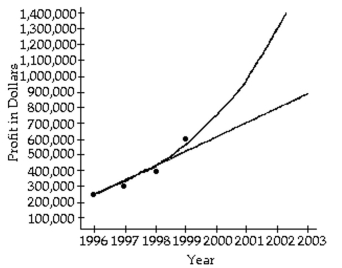
A) About $800,000
B) About $500,000
C) About $1,000,000
D) About $900,000
Correct Answer:

Verified
Correct Answer:
Verified
Q47: Using a calculator, find to the nearest
Q48: Solve the problem. When appropriate, round the
Q49: Find an equation of the inverse of
Q50: Solve.<br>-<img src="https://d2lvgg3v3hfg70.cloudfront.net/TB8504/.jpg" alt="Solve. - A) 0
Q51: Write the word or phrase that best
Q53: Graph the function.<br>-f(x) = <img src="https://d2lvgg3v3hfg70.cloudfront.net/TB8504/.jpg" alt="Graph
Q54: Solve.<br>-<img src="https://d2lvgg3v3hfg70.cloudfront.net/TB8504/.jpg" alt="Solve. - = -3
Q55: Express as a single logarithm.<br>-<img src="https://d2lvgg3v3hfg70.cloudfront.net/TB8504/.jpg" alt="Express
Q56: Graph the function.<br>-<img src="https://d2lvgg3v3hfg70.cloudfront.net/TB8504/.jpg" alt="Graph the function.
Q57: Solve the equation.<br>-<img src="https://d2lvgg3v3hfg70.cloudfront.net/TB8504/.jpg" alt="Solve the equation.