Short Answer
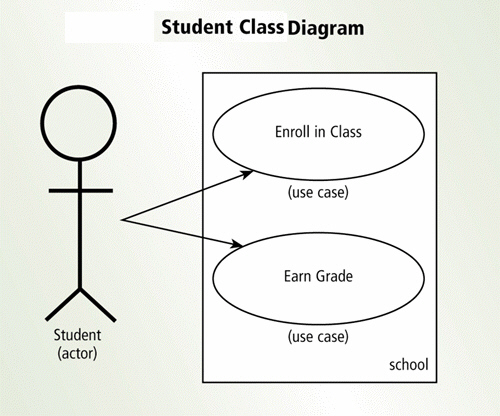 As shown in the accompanying figure, a(n) ____________________ diagram graphically shows how actors interact with an information system.
Correct Answer:

Verified
Correct Answer:
Verified
Related Questions
Q97: The _ becomes the first item in
Q100: In the preliminary investigation, the systems analyst
Q146: Which of the following measures how well
Q152: The purpose of the _ study is
Q171: During which of the following phases does
Q174: Which of the following systems is a
Q175: COGNITIVE ASSESSMENT What is structured analysis and
Q179: In this phase, system developers perform four
Q180: COGNITIVE ASSESSMENT Which of the following terms
Q181: Although used in all types of business