Multiple Choice
FIGURE 2-1
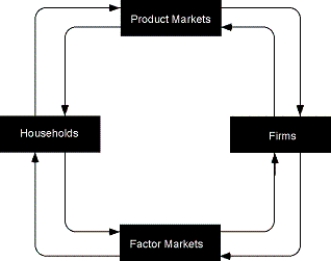
-Refer to Figure 2-1. What does the arrow from the product markets to the firms represent?
A) revenue
B) goods and services sold
C) money income
D) wages, rent interest, and profits
Correct Answer:

Verified
Correct Answer:
Verified
Q23: The production possibilities curve marks the boundary
Q55: FIGURE 2-8<br> <img src="https://d2lvgg3v3hfg70.cloudfront.net/TB5767/.jpg" alt="FIGURE 2-8
Q57: When more resources in an economy are
Q61: Why is a production possibilities curve negatively
Q62: FIGURE 2-12<br> <img src="https://d2lvgg3v3hfg70.cloudfront.net/TB5767/.jpg" alt="FIGURE 2-12
Q63: If an economy is operating inside its
Q65: Which of the following illustrates excessive unemployment
Q81: An increase in an economy's capital stock
Q92: In the simple circular flow model of
Q100: How can we measure the opportunity cost