Multiple Choice
FIGURE 2-2
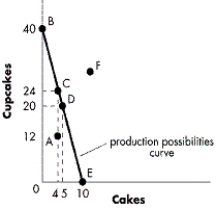
-Refer to Figure 2-2. Which of the following statements best describes the opportunity cost of producing an additional cake?
A) It increases as the economy moves in a southeast direction along the production possibilities curve.
B) It decreases as the economy moves in a southeast direction along the production possibilities curve.
C) It remains constant as the economy moves in a southeast direction along the production possibilities curve.
D) It equals zero.
Correct Answer:

Verified
Correct Answer:
Verified
Q53: An increase in available resources will tend
Q68: FIGURE 2-11<br> <img src="https://d2lvgg3v3hfg70.cloudfront.net/TB5767/.jpg" alt="FIGURE 2-11
Q70: Which of the following would NOT be
Q71: High-wage countries like Canada tend to use
Q72: Which of the following would mostly likely
Q74: FIGURE 2-4<br> <img src="https://d2lvgg3v3hfg70.cloudfront.net/TB5767/.jpg" alt="FIGURE 2-4
Q75: Which of the following is NOT a
Q76: FIGURE 2-7<br> <img src="https://d2lvgg3v3hfg70.cloudfront.net/TB5767/.jpg" alt="FIGURE 2-7
Q77: Which of the following describes when an
Q78: FIGURE 2-14<br> <img src="https://d2lvgg3v3hfg70.cloudfront.net/TB5767/.jpg" alt="FIGURE 2-14