Multiple Choice
FIGURE 2-3
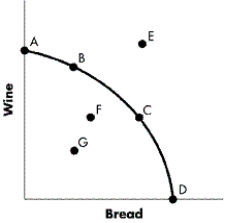
-Refer to Figure 2-3. What is the most inefficient point depicted?
A) Point A
B) Point C
C) Point D
D) Point G
Correct Answer:

Verified
Correct Answer:
Verified
Related Questions
Q52: Illustrate a production possibilities curve for automobiles
Q66: Other things being constant, an economy must
Q123: What does a market economy depend on
Q124: What is the term for a system
Q125: In the circular flow model, in what
Q126: Assume the economy moves from a situation
Q129: FIGURE 2-3<br> <img src="https://d2lvgg3v3hfg70.cloudfront.net/TB5767/.jpg" alt="FIGURE 2-3
Q130: How might an increase in the unemployment
Q131: Is increased capital spending the only way
Q132: FIGURE 2-2<br> <img src="https://d2lvgg3v3hfg70.cloudfront.net/TB5767/.jpg" alt="FIGURE 2-2