Multiple Choice
FIGURE 2-6
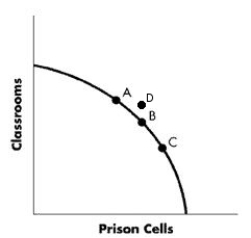
-Refer to Figure 2-6. The diagram represents a trade-off in an economy between prison cells and classrooms. Which position represents the choice to allocate the greatest amount of resources to producing classrooms?
A) Point A
B) Point B
C) Point C
D) Point D
Correct Answer:

Verified
Correct Answer:
Verified
Q19: What occurs with a movement in a
Q20: Three economic questions must be determined in
Q21: FIGURE 2-1<br> <img src="https://d2lvgg3v3hfg70.cloudfront.net/TB5767/.jpg" alt="FIGURE 2-1
Q22: FIGURE 2-3<br> <img src="https://d2lvgg3v3hfg70.cloudfront.net/TB5767/.jpg" alt="FIGURE 2-3
Q25: Which one of the following will NOT
Q26: Which of the following will shift the
Q27: Which of the following best describes economic
Q28: FIGURE 2-14<br> <img src="https://d2lvgg3v3hfg70.cloudfront.net/TB5767/.jpg" alt="FIGURE 2-14
Q29: How does the fact that resources are
Q40: The opportunity cost of a particular good