Multiple Choice
FIGURE 2-8
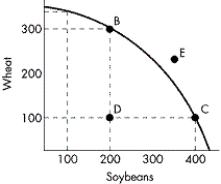
-Refer to Figure 2-8. In order to move from Point D to Point C, what will the economy have to give up?
A) 200 bushels of soybeans
B) 200 bushels of wheat
C) 100 bushels of wheat
D) nothing
Correct Answer:

Verified
Correct Answer:
Verified
Q46: FIGURE 2-3<br> <img src="https://d2lvgg3v3hfg70.cloudfront.net/TB5767/.jpg" alt="FIGURE 2-3
Q47: Which of the following distinguishes a "straight-line"
Q48: What does a linear (straight line) production
Q49: Which of the following is NOT a
Q52: How can economic growth be illustrated?<br>A) by
Q53: FIGURE 2-9<br> <img src="https://d2lvgg3v3hfg70.cloudfront.net/TB5767/.jpg" alt="FIGURE 2-9
Q54: Along a straight-line production possibilities curve, which
Q55: FIGURE 2-8<br> <img src="https://d2lvgg3v3hfg70.cloudfront.net/TB5767/.jpg" alt="FIGURE 2-8
Q100: How can we measure the opportunity cost
Q165: A decrease in the unemployment rate will