Multiple Choice
FIGURE 2-12
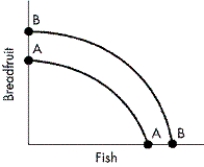
-Refer to Figure 2-12. Which of the following would most likely cause the production possibilities curve for breadfruit and fish to shift from AA to BB?
A) a decrease in the production of fish over breadfruit
B) a reduction in the size of the available labour force
C) an increase in the stock of capital
D) an increase in the production of fish over breadfruit
Correct Answer:

Verified
Correct Answer:
Verified
Q84: Market economies are often criticized for how
Q86: How can a decrease in the unemployment
Q87: What will occur when a command economy
Q88: FIGURE 2-1<br> <img src="https://d2lvgg3v3hfg70.cloudfront.net/TB5767/.jpg" alt="FIGURE 2-1
Q90: Which of the following is the most
Q91: FIGURE 2-3<br> <img src="https://d2lvgg3v3hfg70.cloudfront.net/TB5767/.jpg" alt="FIGURE 2-3
Q92: When does the law of increasing opportunity
Q93: FIGURE 2-4<br> <img src="https://d2lvgg3v3hfg70.cloudfront.net/TB5767/.jpg" alt="FIGURE 2-4
Q94: When you buy groceries at your local
Q118: An improvement in technology will tend to