Multiple Choice
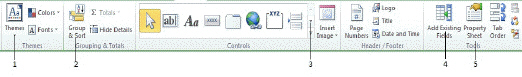 In the figure above, item 3 helps you____.
A) add controls to the report that are not currently visible
B) set the tab order for the report
C) set sorting and grouping fields
D) enter expressions for calculations
Correct Answer:

Verified
Correct Answer:
Verified
Q3: Lines can be difficult to find in
Q6: <img src="https://d2lvgg3v3hfg70.cloudfront.net/TBX9067/.jpg" alt=" In the figure
Q10: <img src="https://d2lvgg3v3hfg70.cloudfront.net/TBX9067/.jpg" alt=" In the figure
Q17: _ reports are reports that show statistics
Q18: Which key do you press and hold
Q36: Which report section would be the most
Q44: Short double lines under the calculations in
Q61: In a report,label controls display data from
Q68: Which report section is most commonly used
Q77: <img src="https://d2lvgg3v3hfg70.cloudfront.net/TB7032/.jpg" alt=" -In Report Design