Multiple Choice
The diagram below represents the market for butter.
FIGURE 4-1
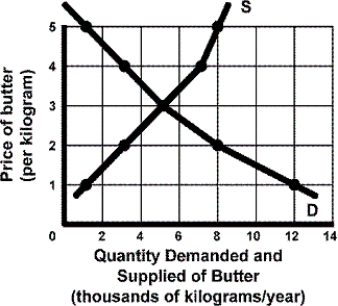
-Refer to Figure 4-1. What is the equilibrium price of butter?
A) $1
B) $2
C) $3
D) $5
Correct Answer:

Verified
Correct Answer:
Verified
Q13: TABLE 4-2<br> <img src="https://d2lvgg3v3hfg70.cloudfront.net/TB5767/.jpg" alt="TABLE 4-2
Q14: TABLE 4-4<br> <img src="https://d2lvgg3v3hfg70.cloudfront.net/TB5767/.jpg" alt="TABLE 4-4
Q15: What does the imposition of a price
Q17: If both market demand and supply increase
Q19: TABLE 4-3<br> <img src="https://d2lvgg3v3hfg70.cloudfront.net/TB5767/.jpg" alt="TABLE 4-3
Q21: Whenever there is a surplus at a
Q22: Suppose there is a reduction in consumer
Q23: Assume a price ceiling is imposed at
Q153: Explain how both sales and long lines
Q166: Serious natural disasters like hurricanes and tornadoes