Multiple Choice
The diagram below represents the market for butter.
FIGURE 4-1
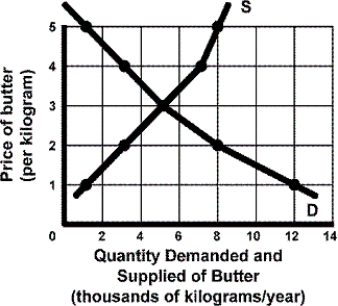
-Refer to Figure 4-1. If the current price of butter equals $5, what is the result in the market?
A) The market is not in equilibrium, and that the quantity supplied is greater than the quantity demanded.
B) The market is not in equilibrium, and that the quantity demanded is greater than the quantity supplied.
C) The market is in equilibrium at 8000 kilograms per year.
D) The market is in equilibrium at 2000 kilograms per year.
Correct Answer:

Verified
Correct Answer:
Verified
Q90: TABLE 4-4<br> <img src="https://d2lvgg3v3hfg70.cloudfront.net/TB5767/.jpg" alt="TABLE 4-4
Q91: In an effort to fight inflation of
Q92: Good A (an inferior good) and Good
Q94: TABLE 4-2<br> <img src="https://d2lvgg3v3hfg70.cloudfront.net/TB5767/.jpg" alt="TABLE 4-2
Q96: If the market for Rolex watches is
Q97: Reuters News Service reports: "Canadian automobile sales
Q98: FIGURE 4-2<br> <img src="https://d2lvgg3v3hfg70.cloudfront.net/TB5767/.jpg" alt="FIGURE 4-2
Q99: FIGURE 4-5<br> <img src="https://d2lvgg3v3hfg70.cloudfront.net/TB5767/.jpg" alt="FIGURE 4-5
Q100: Which action will always result in a
Q152: Markets tend toward equilibrium and, as a