Multiple Choice
The diagram below represents the market for butter.
FIGURE 4-1
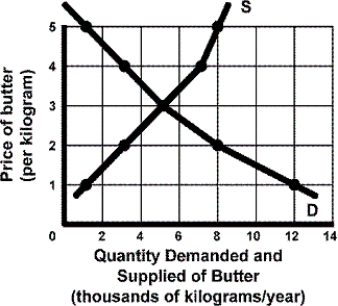
-Refer to Figure 4-1. If a price ceiling of $2 is imposed, how many units of butter will be sold?
A) 3000
B) 4000
C) 5000
D) 8000
Correct Answer:

Verified
Correct Answer:
Verified
Q31: TABLE 4-2<br> <img src="https://d2lvgg3v3hfg70.cloudfront.net/TB5767/.jpg" alt="TABLE 4-2
Q32: TABLE 4-2<br> <img src="https://d2lvgg3v3hfg70.cloudfront.net/TB5767/.jpg" alt="TABLE 4-2
Q33: TABLE 4-1<br> <img src="https://d2lvgg3v3hfg70.cloudfront.net/TB5767/.jpg" alt="TABLE 4-1
Q35: If a shortage currently exists in the
Q37: Price floors get their name from the
Q37: TABLE 4-3<br> <img src="https://d2lvgg3v3hfg70.cloudfront.net/TB5767/.jpg" alt="TABLE 4-3
Q38: With knowledge about the direction (but not
Q39: FIGURE 4-2<br> <img src="https://d2lvgg3v3hfg70.cloudfront.net/TB5767/.jpg" alt="FIGURE 4-2
Q40: If the supply curve for housing has
Q41: What will tend to happen in the