Multiple Choice
FIGURE 4-4
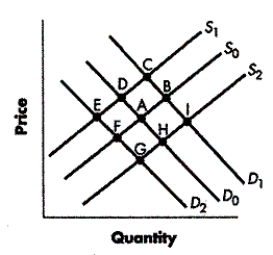
-Refer to Figure 4-4. Starting with initial curves D₀ and S₀, which movement is consistent with a decrease in both demand and supply?
A) from Point A to Point F
B) from Point A to Point E
C) from Point A to Point C
D) from Point A to Point I
Correct Answer:

Verified
Correct Answer:
Verified
Q76: What could explain an increase in the
Q77: In 1975, a pocket calculator cost more
Q78: Coca-Cola bottlers increased their prices as the
Q79: Wool and cotton can both be used
Q80: If the price of ice cream increases
Q82: TABLE 4-2<br> <img src="https://d2lvgg3v3hfg70.cloudfront.net/TB5767/.jpg" alt="TABLE 4-2
Q83: TABLE 4-2<br> <img src="https://d2lvgg3v3hfg70.cloudfront.net/TB5767/.jpg" alt="TABLE 4-2
Q84: If market demand decreases and market supply
Q85: What is occurring in the market when
Q86: The main purpose of government price controls