Short Answer
You are writing your yearly report for the sales company you work for, which has two sales teams. You have created a chart that shows the quarterly breakdown of each team's 2013 sales. 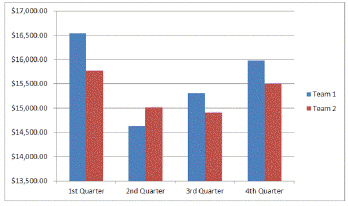
How could you make the chart look more attractive?
Correct Answer:

Verified
You could apply a style to the chart. Cl...View Answer
Unlock this answer now
Get Access to more Verified Answers free of charge
Correct Answer:
Verified
You could apply a style to the chart. Cl...
View Answer
Unlock this answer now
Get Access to more Verified Answers free of charge
Related Questions
Q2: Deselect the _ check box if you
Q42: Describe how to create a WordArt object
Q43: After clicking the Crop button, _ (solid
Q44: Moving an inline graphic using the _
Q46: You can drag a(n) _ to modify
Q48: Use the Chart button in the _
Q49: The Word SmartArt feature lets you illustrate
Q50: When a graphic is sized to _,
Q51: A text box is inserted into a
Q52: When you press [Shift][Ctrl] while dragging a