Multiple Choice
FIGURE 5-1
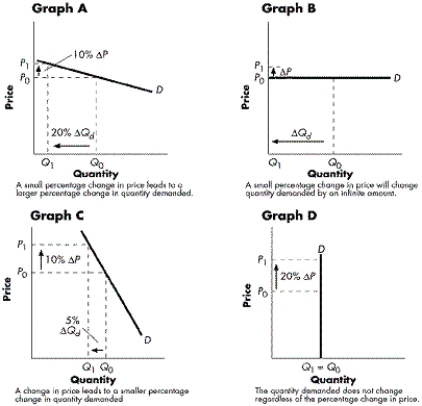
-Refer to Figure 5-1. What graph best illustrates a relatively inelastic (but NOT perfectly inelastic) demand curve?
A) Graph A
B) Graph B
C) Graph C
D) Graph D
Correct Answer:

Verified
Correct Answer:
Verified
Related Questions
Q16: The elasticity in the vicinity of five
Q17: Price elasticity of demand is a measure
Q18: The price of peanut butter decreases. As
Q19: If the supply curve for aspirin is
Q20: If the income elasticity of demand for
Q22: What is the direction of a perfectly
Q23: What does the price elasticity of demand
Q24: The widespread availability of email has likely
Q25: If the supply curve for a product
Q26: FIGURE 5-2<br> <img src="https://d2lvgg3v3hfg70.cloudfront.net/TB5767/.jpg" alt="FIGURE 5-2