Multiple Choice
FIGURE 5-2
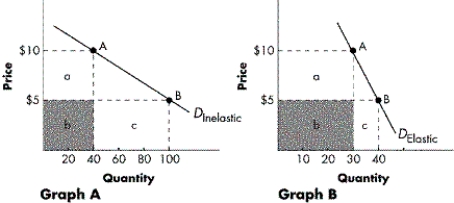
-Refer to Figure 5-2. With reference to Graph B, at a price of $5, what is total revenue equal to?
A) $150
B) $200
C) $250
D) $300
Correct Answer:

Verified
Correct Answer:
Verified
Related Questions
Q62: FIGURE 5-3<br> <img src="https://d2lvgg3v3hfg70.cloudfront.net/TB5767/.jpg" alt="FIGURE 5-3
Q64: If the measured elasticity of supply coefficient
Q65: FIGURE 5-2<br> <img src="https://d2lvgg3v3hfg70.cloudfront.net/TB5767/.jpg" alt="FIGURE 5-2
Q66: Apples and oranges are substitute goods. The
Q68: Most passenger trains operate far below full
Q69: Which of the following best describes the
Q70: The demand for a normal good is
Q71: A 10 percent decrease in the price
Q72: What term accurately describes demand when the
Q271: Among the following pairs, which is likely