Multiple Choice
FIGURE 5-3
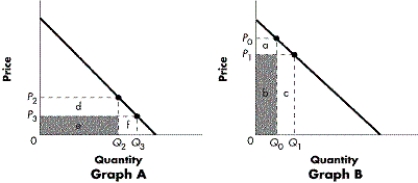
-Refer to Figure 5-3. Elasticity varies along a linear demand curve. What does Graph A represent?
A) the section of the curve where, starting at P2, a decrease in price will lead to an increase in total revenue
B) the section of the curve where Ed is < 1
C) the section of the curve where the percentage change in quantity is larger than the percentage change in price
D) the section of the curve where the curve is elastic
Correct Answer:

Verified
Correct Answer:
Verified
Q36: The Shoe Emporium reduces the price of
Q37: A tax is imposed on orange juice.
Q38: The cross-price elasticity between soda and salty
Q40: A 10 percent increase in income leads
Q42: If the demand curve is perfectly elastic,
Q43: What tends to happen to the elasticity
Q44: When a 5 percent increase in price
Q45: The elasticity of supply coefficient for lobster
Q46: After a drought in Alberta, the availability
Q125: An increase in price will cause a