Multiple Choice
FIGURE 5-3
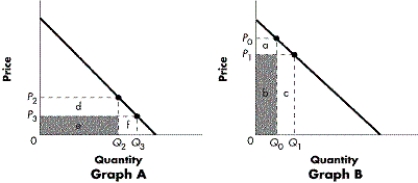
-Refer to Figure 5-3. Elasticity varies along a linear demand curve. What does Graph B represent?
A) the section of the curve where the curve is inelastic
B) the section of the curve where Ed is < 1
C) the section of the curve where, starting at P1, an increase in price will lead to an increase in total revenue
D) the section of the curve where the percentage change in quantity is larger than the percentage change in price
Correct Answer:

Verified
Correct Answer:
Verified
Q103: Suppose that Lance purchases one pizza per
Q104: Iron Mike's steel mill finds that a
Q105: Suppose that Percy eats a 200-gram steak
Q106: When the price of ulcer medication increased
Q107: How is the elasticity of supply defined?<br>A)
Q109: What term accurately describes demand when the
Q110: The nation's largest cable TV company tested
Q112: A 25 percent decrease in the price
Q113: Which of the following is likely to
Q200: Given an upward sloping supply curve,the more