True/False
According to the stem-and-leaf plot below, the median quiz score for this data set is 8. 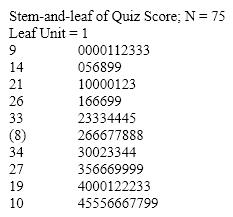
Correct Answer:

Verified
Correct Answer:
Verified
Related Questions
Q8: In a pie chart,each slice is proportional
Q13: A line chart that is flat shows
Q30: If two variables have a strong linear
Q35: Explain the difference between a histogram and
Q41: In order to draw a scatter diagram,we
Q43: Twenty-five voters participating in a recent election
Q57: The classification of student class designation (freshman,sophomore,junior,senior)is
Q60: A(n)_ histogram has two peaks,not necessarily equal
Q63: Which of the following statements about shapes
Q107: Electronics Company At a meeting of regional