menu-iconExamlexExamLexServices

Discover

Ask a Question
  1. All Topics
  2. Topic
    Statistics
  3. Study Set
    BSTAT Study Set 1
  4. Exam
    Exam 2: Graphical and Tabular Descriptive Techniques
  5. Question
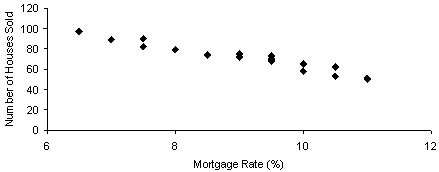
    The Graph Below Represents a Line Graph
Solved

The Graph Below Represents a Line Graph

Question 180

Question 180

True/False

The graph below represents a line graph. The graph below represents a line graph.

Correct Answer:

verifed

Verified

Unlock this answer now
Get Access to more Verified Answers free of charge

Related Questions

Q6: It is typical that when taking an

Q53: Identify the type of data for which

Q61: A histogram is said to be symmetric

Q66: When one variable increases and the other

Q101: The sum of relative frequencies in a

Q107: Time series data are often graphically depicted

Q136: A line chart is created by plotting

Q137: One of the variables used to help

Q150: The intervals (classes)in a histogram are equally

Q183: Electronics Company At a meeting of regional
Examlex

ExamLex

About UsContact UsPerks CenterHomeschoolingTest Prep

Work With Us

Campus RepresentativeInfluencers

Links

FaqPricingChrome Extension

Download The App

Get App StoreGet Google Play

Policies

Privacy PolicyTerms of ServiceHonor CodeCommunity Guidelines

Scan To Download

qr-code

Copyright © (2025) ExamLex LLC.

Privacy PolicyTerms Of ServiceHonor CodeCommunity Guidelines