True/False
The line chart below shows tomato prices each month from January (month 1)to December last year ($ per pound). By looking at this chart you can see the lowest tomato prices occurred in July. 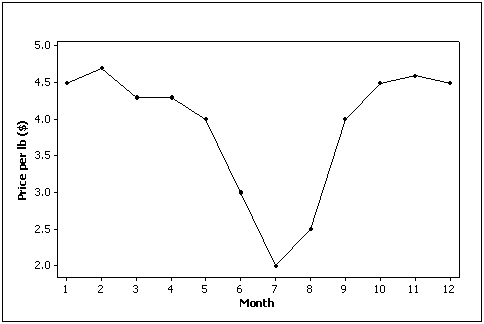
Correct Answer:

Verified
Correct Answer:
Verified
Q20: Insurance Company A representative from a local
Q33: A line chart is created by plotting
Q48: The classification of student major (accounting,economics,management,marketing,other)is an
Q55: {Test Grades Narrative} Construct frequency and relative
Q57: In applications involving two variables,X and Y,where
Q64: A cumulative relative frequency distribution lists the
Q66: NARRBEGIN: Home Care<br>Home Care<br>Data are collected on
Q79: The Dean of Students conducted a survey
Q88: NARRBEGIN: Home Care<br>Home Care<br>Data are collected on
Q138: The advantage of a stem-and-leaf display over