True/False
The line chart below shows cucumber prices fluctuated from $2.00 per pound to over $4.50 per pound during the year. 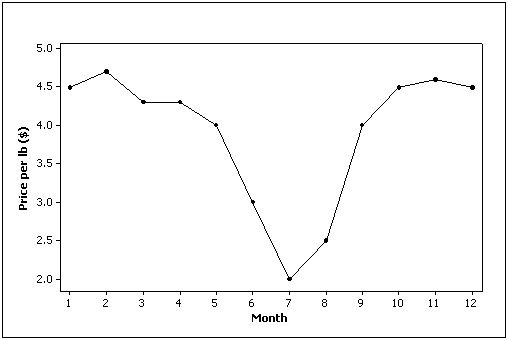
Correct Answer:

Verified
Correct Answer:
Verified
Related Questions
Q2: For which type of data are the
Q8: For what type of data is a
Q20: A bar chart is used to represent
Q81: The Chief of Police conducted a survey
Q87: A(n)_ chart is often used to display
Q88: Briefly discuss the difference between cross-sectional data
Q89: According to the stem-and-leaf plot below, this
Q90: Beef prices throughout the year (month 1
Q113: A histogram is said to be _
Q129: A(n)_ histogram is one with a long