True/False
A professor examines the relationship between minutes studying and exam score (out of 200 points)for a random sample of his students. The scatter diagram is shown below. It appears that study time has somewhat of a positive linear relationship with exam score. 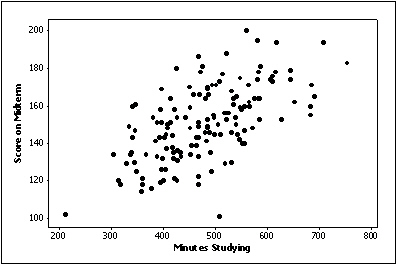
Correct Answer:

Verified
Correct Answer:
Verified
Related Questions
Q20: A bar chart is used to represent
Q27: We can summarize nominal data in a
Q35: At the end of a safari,the tour
Q41: In order to draw a scatter diagram,we
Q43: Twenty-five voters participating in a recent election
Q63: Which of the following statements about shapes
Q87: A(n)_ chart is often used to display
Q90: Beef prices throughout the year (month 1
Q96: The graph below is an example of
Q113: A histogram is said to be _