Essay
Business School Graduates A sample of business school graduates were asked what their major was. The results are shown in the following frequency distribution. 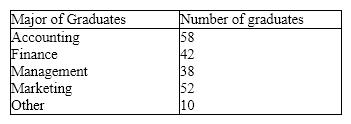 {Business School Graduates Narrative} Draw a pie chart of this data. Are you able to reconstruct the original data from this pie chart alone?
Correct Answer:

Verified
 No; you cannot reconstruct th...
View Answer
Unlock this answer now
Get Access to more Verified Answers free of charge
Correct Answer:
Verified
View Answer
Unlock this answer now
Get Access to more Verified Answers free of charge
Q4: Which of the following situations is best
Q50: Your gender is a nominal variable.
Q56: Your final grade in a course (A,B,C,D,E)is
Q67: The more observations we have,the _ the
Q76: Which of the following is the method
Q130: A graph of the frequency distribution for
Q134: Which of the following describes the shape
Q135: Compare the two histograms below. Which statement
Q136: Teachers Ages The ages (in years)of a
Q138: Internet Classes A survey of 25 students