Essay
The number of houses sold in Miami Springs and the average monthly mortgage rates for 18 months randomly selected between January 2011 and April 2013 are shown in the following table.
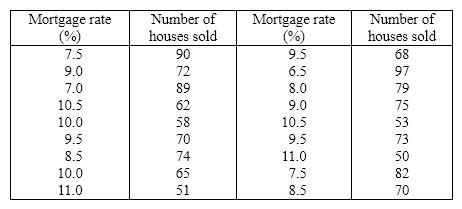
a. Draw a scatter diagram with the number of houses sold on the vertical axis.
b. Describe the relationship between mortgage rate and number of houses sold.
Correct Answer:

Verified
a. 
b. There is a strong neg...View Answer
Unlock this answer now
Get Access to more Verified Answers free of charge
Correct Answer:
Verified
b. There is a strong neg...
View Answer
Unlock this answer now
Get Access to more Verified Answers free of charge
Q2: When a distribution has more values to
Q4: Which of the following situations is best
Q9: For what type of data are frequencies
Q21: With nominal data,there is one and only
Q50: Your gender is a nominal variable.
Q56: Your final grade in a course (A,B,C,D,E)is
Q76: Which of the following is the method
Q92: Values must represent ordered rankings for what
Q130: A graph of the frequency distribution for
Q134: A(n)_ is a table that sorts data